
Knowledge is at the core of any successful initiative. In the age of data, one would think that the task of incorporating knowledge would be easier than ever.
However, the three Vs—volume, velocity and veracity of data—make the task anything but easy. What is an effective way to accomplish the same?
Enter knowledge graphs.
Graphical representation of knowledge has been around for decades now, dating back to the 1960s.
In our previous article, we talked about graph tech (databases, processing, and visualization). We also explored how it solves multiple pain points that impede data-driven initiatives from operating at high efficiency.
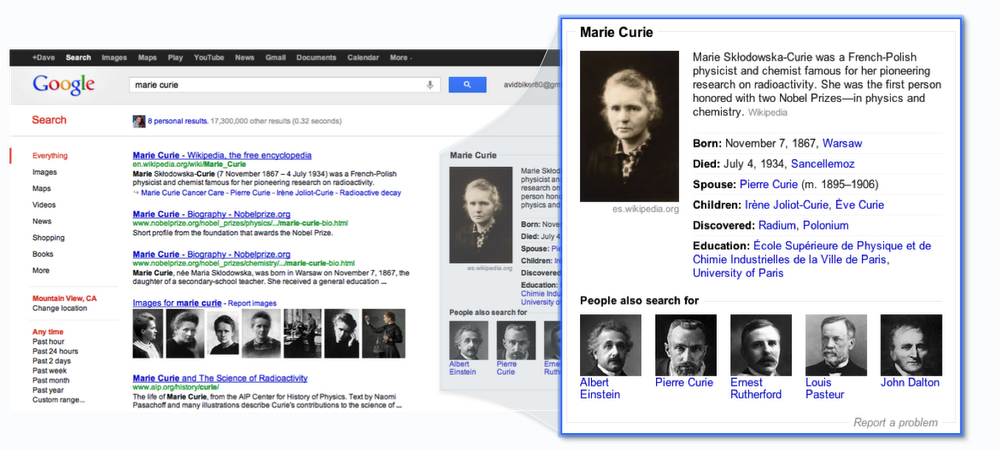
A key point in the rise of graph tech was Google unveiling its knowledge graph (KG) back in 2012.
Some of the biggest technology companies have knowledge graphs (KG) at their core. In 2018, Gartner included KGs in the technology hype cycle.
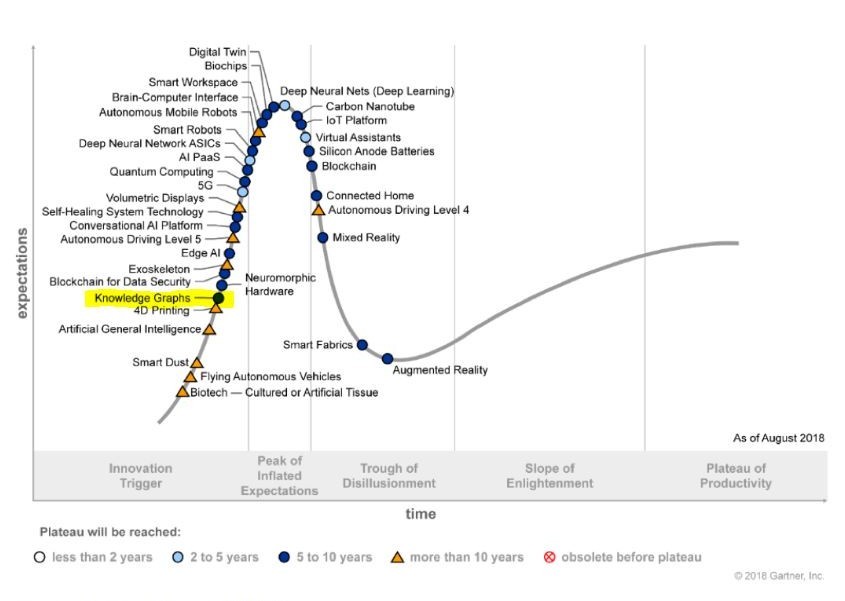
Photo courtesy: Gartner
What is a knowledge graph (KG)?
Despite prominent academic and industry examples, there is a lot of confusion around the term knowledge graph. The 2016 paper “Towards a definition of knowledge graphs” explored this dilemma and tried to provide a definition.
You can also find other reasonable definitions online. Building upon these definitions, here’s my attempt to provide one:
A knowledge graph is made of a graph data store coupled with a knowledge toolkit. It stores a domain’s data as entities and relationships using a graph model, which abides by an ontology.
The knowledge toolkit supports continuous integration of data from multiple sources, allows end-users to query the graph effectively, and draws inferences from existing information.
Think of ontology as loosely being a schema for graph data. This isn’t entirely accurate, but it is a helpful way to start. A domain’s ontology defines its members (entities, relationships) and their properties in a way that resembles the real world. Read more about it here.
Also, t
Why care about knowledge graphs (KGs)?
When Google introduced KGs, they wrote a blog that mentioned how KGs allowed users to search through “things, not strings”. Graphs, being closer to our mental models, make it easy to describe your data as real-world objects.
A KG comes with the usual advantages of graph tech. That means freedom from expensive join operations, whiteboard-friendly data models, effective handling of sparse data, and access to handy algorithms such as PageRank. Graphs can also help improve the current state of ML. In particular, graph neural networks have been in the news lately.
Now, throw in a robust knowledge toolkit and you get:
- Continuous integration of data from multiple sources and of different formats, from structured (RDBMS) to unstructured (text and images).
- Logical reasoning and inference capabilities. For example, from relationships such as “A works for chemistry department” and “B manages chemistry department”, the system should infer “B is A’s manager”.
- Entity resolution and extraction capabilities to deal with messy data and multiple versions of facts. The image illustrated below shows an example where a person has two different records associated with their name, and this situation has to be fixed.
first name | last name  | address          | phone   |
------------------------------------------------------
Sal        | khan       | 10 m nagar       | 91-0123 |
Salman     | Khan       | 10 Malviya Nagar |         |
Moreover, a KG acts as a shared source of truth and a common interface for multiple teams and even entire organizations. For example, an ML model using data from numerous departments needs to query the KG’s entities and relationships rather than data from multiple silos (warehouses, lakes, and RDBMSes).
What does the semantic web have to do with it?
You may often find knowledge graphs and semantic web mentioned in the same context. For some time, semantic web technology and standards were synonymous with KGs. That’s not the case now.
Notice how the definition above says nothing about specific standards.
Building your graph using semantic web standards offers advantages, including easy integration with many public knowledge bases published using the same standards. However, the associated complexity and steep learning curve may make it harder and less useful.
So how do I work with it?
Either of the following methods can provide access to a KG:
- Visual layer: A visual explorer and an intuitive interface can be used to provide a graph-browsing experience to the end-user. This is particularly useful for domain-experienced users who may not be adept with programming or query languages.
- Query layer: Languages such as Sparql, Gremlin and Cypher can be used to query the databases that store the KG.
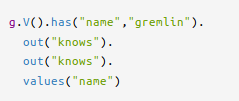
Query courtesy: Apache Tinkerpop
- API layer: Being able to access the KG via REST or a programming language is useful when developing applications.
Knowledge graphs in the wild
Successful examples exist across industries, academia and public domain.
- Some of the internet’s largest companies, including Google, Microsoft (Bing, LinkedIn), Facebook, Alibaba
and Uber, use KGs to power their internal and external services. - Organizations such as NASA (research) and Thomson Reuters (finance) have embraced KGs too.
- CMU’s NELL (Never-Ending Language Learning) is an academic project attempting to create a computer system that learns to read the web and uses a KG to store information.
The GDelt project is a real-time global open data graph. It continuously extracts information from news media across the world.
Challenges with knowledge graphs
Knowledge graphs are used across different industries and their use cases may differ in their capabilities. But the core challenges they face in implementing a useful knowledge toolkit are the same.
- Entity disambiguation and resolution: Different sources may refer to the same entity differently. Other times, different entities may share properties such as name. We need to assign unique normalized identities to entities in our graph.
- Knowledge extraction and integration: Despite recent advances in ML and Natural Language Processing (NLP), extraction of information from heterogeneous sources (text, RDBMS, and PDFs) remains a challenge. Integrating them isn’t a straightforward task either.
- Managing changes: Coupled with the identity challenge, capturing the evolution of knowledge over time can become difficult. A KG may need to store temporal shifts and history. For example, if a company gets acquired, how does one manage both its new and old identities?
- Easy access: A user interface can be a query editor, visual explorer, or a programmatic interface such as a software library or API.
- Security and privacy: If KGs are to be deployed widely, they must provide value while keeping in mind privacy and security concerns.
- Operating at scale: All of the above become trickier to solve for when the challenge of scale kicks in.
At Atlan, we’ve been working towards tackling data democratization for data teams around the world. We deal with exciting challenges daily, including the ones listed above. Stay tuned to hear about our experiences soon.
Final words
Connected data is more important than ever. Being able to bring together silos effectively is critical for extracting value out of your data. Knowledge graphs provide a great way to do the same. It can empower stakeholders ranging from business users (improved data discovery) to data scientists (better ML models).
Going about building and operating a knowledge graph does come with challenges. But an effective toolkit to do so can help you navigate the challenges.
If you want to understand whether KGs suit your use case or have a question, please leave a comment. 🙂
Author’s note: Here are some references that helped me when researching for this post.
- Industry-scale knowledge graphs: Lessons and challenges
- Towards a definition of knowledge graphs
- Knowledge graphs beyond the hype:
getting knowledge in and out of graphs and databases
Featured image credits: The GDELT Project

1 Comment
Pingback: Distilled News | AnalytiXon