Background
As a licensed digital peer-to-peer (P2P) lending platform in South East Asia, Funding Societies | Modalku is subject to several regulatory and compliance requirements which factor into its data strategy.
Data is becoming an increasingly valuable asset and gives rise to significant competitive advantages in the FinTech world. Indeed, without high quality data and upward reporting of meaningful management information, financial institutions cannot identify and monitor risks. Nor can they properly understand the performance of various business functions.
Organisations with a solid understanding of data governance are better equipped with decision making; uniform data across the organisation; increased data literacy; and improved regulatory compliance.
What follows is part 2 of Funding Societies’ data governance journey where we will cover its implementation. The rest of Part 1 can be found here.
Solution implementation using Atlan
We onboarded Atlan as our Data Management Platform and were able to implement our initial data management and governance goals, outlined below.
Data catalog and discovery
A data catalog is a neatly organised inventory of data assets across all your data sources — a place where your data, associated metadata, and data management and discovery tools are ordered, indexed, and easily accessible for your organisation’s data users and business needs.. It promotes the democratisation of data within your organisation, therefore ensuring your team can easily discover and consume them.
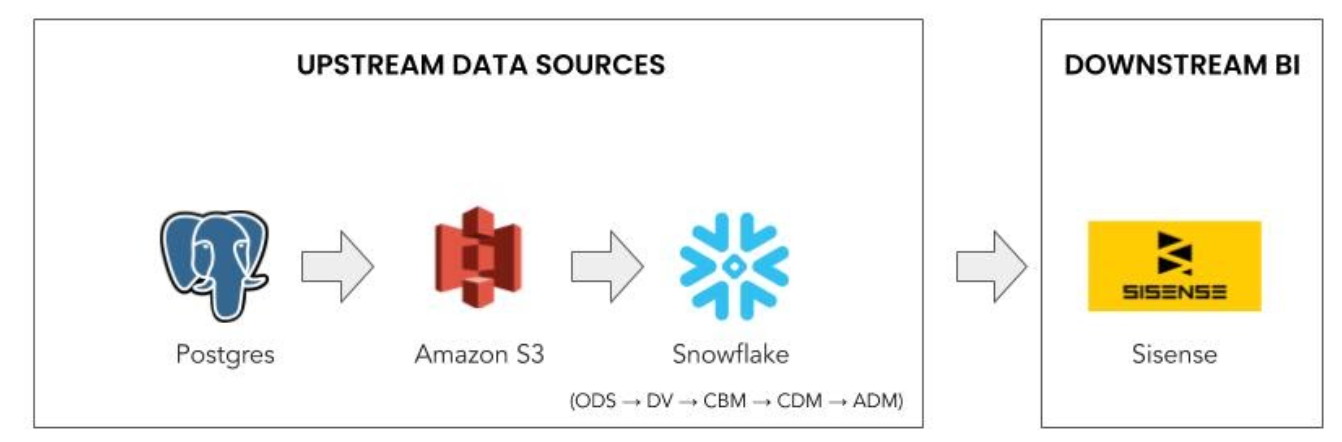
We started with exploring our data landscape by bringing in all the structured data assets into the Atlan. Atlan natively supports Postgres and Snowflake and we started with these integrations. Our approach to this was as follows:
- Select the source, e.g., Postgres/Snowflake 😉
- Provide your credentials ✍️
- Set up your configuration 🗄 ️(e.g., selecting the database)
- Scheduling automatic updates 🕑. Deciding whether to run the crawler once-off, or to run it daily, weekly, or monthly.
Atlan UI has many features to help discover the data assets.
It has a Google-like search experience to find data assets — which can be sorted by relevance/popularity. The UI also features filters on the side, which resemble something similar to what you’d find on e-commerce websites. This enables you to explore the catalog easily.
Data Dictionary: Atlan data dictionary is auto generated and provides a complete profile of the data. Below is the view of data asset analysis available in Atlan for the user.
With Atlan, we were able to discover and manage 2,500+ data assets from diverse data sources (i.e., the tables from Snowflake & Postgres, and BI dashboards from Sisense) with over 46,000 columns
Automated lineage and impact analysis
Generating lineage is not an easy task. Each organisation has a different data landscape and orchestration tools to build the data pipeline. We worked closely with the Atlan team to have lineage created down to a column-level based on our data pipeline architecture.
Seeing a visual representation of the data pipeline and how data flows across different sources in the organisation is very powerful and can save a lot of time that would otherwise be spent on internal communication and debugging.
Atlan sets up lineage by automating wherever possible. This can be achieved by parsing SQL queries or using APIs to create dependencies between tables and columns. Atlan’s lineage view provides a clear picture of the entire flow of the data.
Data lineage graph view allows users to adjust the lineage depth across upstream/downstream layers with zoom in/out option. This is done dynamically. It provides a clear visual demarcation between the source (or origin) asset and impacted assets. All source assets are shown using green connecting lines, and impacted assets using red connecting lines. The process nodes display the code/process used to create the tables and relationships.
Data lineage tree view makes navigating through the lineage of tables even simpler. The navigation experience is similar to browsing through a folder structure. To view the details, just click on the table, or the code, and its information will be visible on the right side view.
Download the impacted assets if you want to see how an asset will impact other assets:.
- Click on the asset whose impacted assets you need.
- Check the preview. An option to download the impacted assets will show up at the bottom.
- Click on this option, and a file with the names and links of all your impacted assets will get downloaded.
If a classification is attached to an asset, it will flow up or down to all the assets. This is classification propagation. For example, if the column Customer Name is tagged as PII, then all the columns created using Customer Name will automatically have PII tagged to it. This reduces a lot of manual work and ensures your data is secure.
Using Atlan’s automated lineage functionality, 50,000+ relationships down to a column-level granularity have been created. We are working with the Atlan team to automate the updating of lineage to reflect data source changes.
Learn more about Atlan’s auto-generating lineage capabilities.
Business glossary
A business glossary is the single source of truth for business context and meaning.
Atlan gives users an option to build glossaries via bulk upload or using the UI.
Bulk glossary upload feature
Creating glossary terms and categories are easier with bulk upload templates and it also links the associated CIA classifications with the respective glossary terms using APIs.
Creating a glossary using the UI
The business glossary can be set up in a hierarchical fashion where the glossary term is the lowest unit that can exist independently inside a glossary or can be grouped within categories: Atlan Glossary → Category → Term.
We use this hierarchy to setup our information asset inventory in the following way:
- Atlan’s Glossary as Information Asset Type/Group: These are data domains like Counterparty, Transaction etc.
- Atlan’s Category as Information Asset Name: like Account Information, Transaction Data etc.
- Atlan’s Term is used for defining various glossary terms associated with Information Asset Names and Data Domains. These are metrics, KPIs, business terminology etc.
Below is the glossary setup done on Atlan:
Data classification
We define all data classifications based on data domains and subdomains; CIA (Confidentiality, Integrity, Availability) rating; PII; GDPR; etc. and map all data assets accordingly.
Atlan provides a powerful data governance layer for management of CIA ratings across 46,000+ column assets using automatic propagation of data classification using the lineage.
Automated data quality profiling
Data profiling helps to determine the accuracy, completeness, structure, and quality of your data.
The process of data profiling involves 👇
- Collecting descriptive statistics like minimum, maximum, mean, median, and standard deviation.
- Collecting data types, along with the minimum and maximum length.
- Determining the percentages of distinct or missing data.
- Tagging data with classification, descriptions, or glossary terms.
- Identifying frequency distributions and significant values.
Below is a snapshot of the data quality profile that shows the calculated metrics across all the columns. The report view provides more details of the quality profile for each column. Atlan allows the user to configure and schedule the data profiling run.
Data access controls and policies
We integrated Atlan with JumpCloud for added security.
Furthermore, Atlan allows you to customise granular access policies suited to your unique organisational needs. We created user groups based on data domains. We customised our access policies on Atlan by specifying the type of access (allow/deny access coupled with view/collaborate access) user groups should have based on the classifications attached to them.
We used JIRA internally to track new user access requests on Atlan.
Below are the steps we follow:
- Users raise JIRA ticket to access Atlan.
- Add the new user to the JumpCloud Atlan user group.
- Add a new user to the groups once a user logs in to Atlan using JumpCloud’s SSO.
- Create access policies for the new users as described above.
The future vision
This is the story of our journey so far as we work towards our goal of making Funding Societies | Modalku a data-centric organisation. We, along with our partner Atlan, are working on several other data governance and management initiatives like data quality, MDM (Master Data Management), and data security.
Thank you for reading this post. Hope this will help you in your Data Management and Governance journey. Feel free to comment with your feedback, suggestions, and questions.
References:
This article was originally published in Medium.
Read the 1st part of this article here.


