
Graphs are elegant and powerful data structures that find application across multiple industries and organizations of varying scale. This article aims to introduce and demystify graph databases and the field of graph tech to the humans of data.
Why should you care about graphs?
- Graphs are an elegant representation of data and cater to various use cases. As a human of data, knowing about them may help you evaluate their utility for your problem statements.
- Graph theory has existed as an academic domain since the 1800s, starting from the Königsberg bridge problem. You can leverage a huge body of related work and theory. Prominent use cases include the shortest path problem, link prediction, and PageRank.

- Developments in the last couple of decades have led to a rise in graph tech. Graphs power internet giants such as Google (knowledge graph), Facebook (social graph), and LinkedIn (economic graph).
What is a graph?
A graph is a set of vertices (nodes, entities) and edges (relationships).
Traditionally, data has been represented in a tabular format. Graphs represent data in a way that’s closer to our mental models.
What about graph tech?
Graph tech refers to software designed to allow users to leverage graph data structures.
Graph tech software could be a database such as Neo4j, DGraph or AWS Neptune, a processing framework like Apache Giraph or Apache Spark’s GraphX, or a visualization tool like Cytoscape.
Let’s compare the graph data format with tabular data structures.
Over the years, tables have emerged as our de-facto format for representing data. Although useful, the tabular model is restrictive since it deals with rows and columns as opposed to real-world entities. Logical and business models get separated from the technical models, which creates a requirement for mediators.
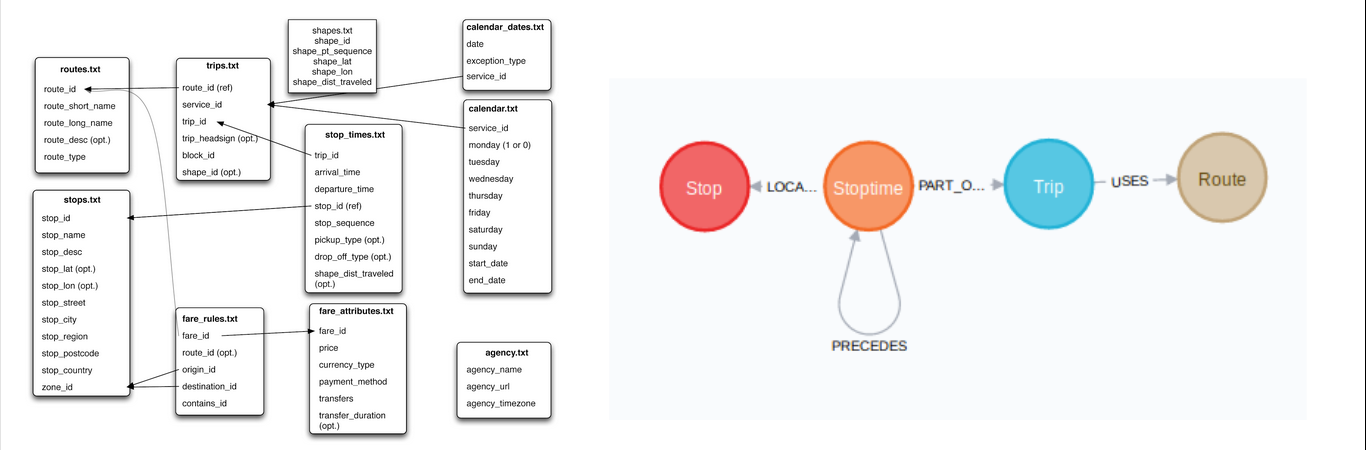
Here’s an example. It involves some GTFS (General Transit Feed Specification) bus transit data from DTC (Delhi Transport Corporation), India.
Originally introduced by Google, GTFS defines a standard format for public transportation schedules and associated geographical information. We use GTFS for journey planning. The data comprises of a bunch of files such as routes, stops, and stop timings, and it paints a picture of bus transport in Delhi.
To perform meaningful analysis, you would either have to join the various tables at query/read time or store them in a denormalized format with repetitions, which can quickly get messy.
Joins are a costly operation. If you’ve dealt with a relational database before, you know how such operations can drive up your costs.
A better way to deal with GTFS data is to store it as a graph. By doing so, we can take advantage of robust graph algorithms for finding shortest paths and connected components. Graphs also make a significant difference visually.
Can you use SQL for graphs?
Given our familiarity with SQL-based solutions, we may be inclined to solve this problem while staying loyal to them instead of opting for graph tech. But that could lead to a world of pain.
Take a look at the following excerpt from Designing Data
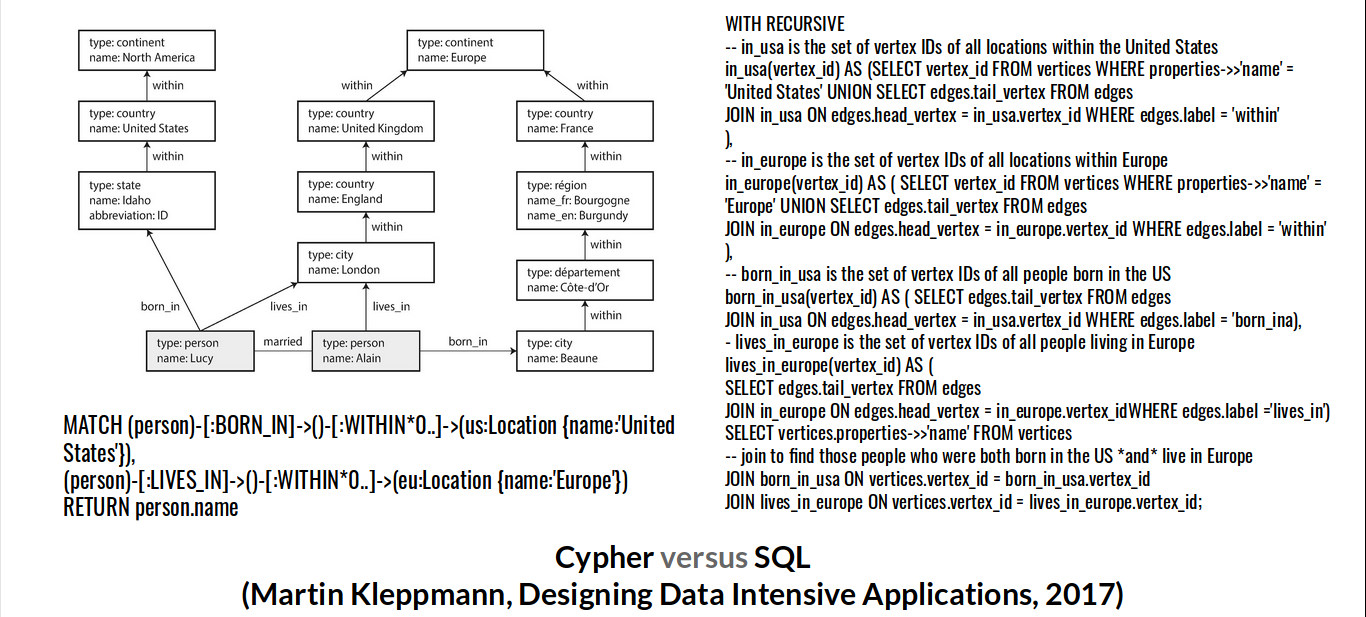
On the top left-hand side, you can see our data model. It shows information about a couple, Lucy and Alain, and their geographical locations. You can notice that there’s a difference in regional structures and granularities between different countries.
What if we decided that we didn’t want to use graph databases?
Just use SQL-based solutions such as Postgres?
While we could create a couple of tables—vertices and edges—SQL wasn’t designed for querying graphs.
A query to create a list of the people who had emigrated from the US to Europe, shown on the right-hand side in the above image, can take some 50 odd lines.
Had we chosen to go with a native graph-based solution, our data model would’ve stayed unchanged.
We could’ve used a graph query language such as Cypher to obtain the same information in just a couple of lines.
Readability counts.
Zen of Python
Why has graph tech become increasingly popular over the years?
A few factors have led graph tech to where it stands today. Here’s a timeline of the growth of graph tech over the last couple of decades.
The Semantic Web
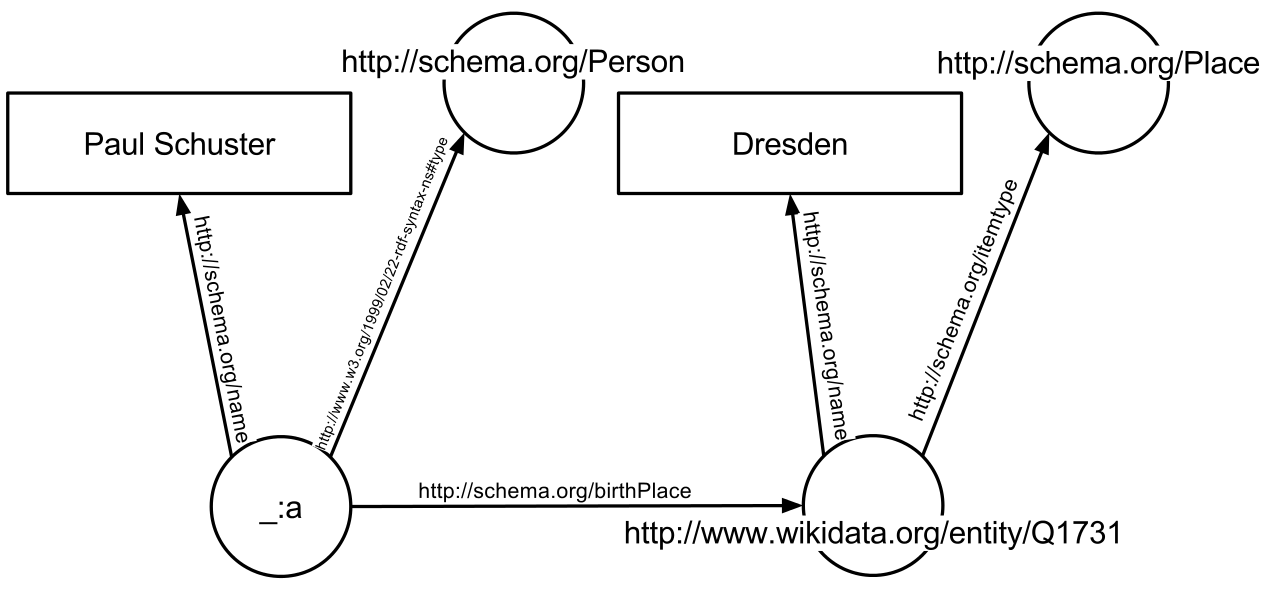
Our story begins in 2001 with the Semantic Web.
Coined by WWW inventor, Tim Berners Lee, and his co-authors in a Scientific American article, it’s modeled as an extension of the web. Semantic loosely means the study of meaning.
The Semantic Web standard aimed to replace the web of pages with a web of things. A key concept was the representation of entities as triples, or subject-object-predicates, i.e. nodes and relationships.
Although Semantic Web didn’t get fully realized, it contributed heavily to the development of graph tech.
Open-source ecosystems
Starting from the late 2000s, a large open-source ecosystem of graph tech—including databases, processing (OLAP/OLTP) and visualization software—has come into being and continues to grow.
There are also several query languages (Cypher, Gremlin) and abstraction layers (GraphQL).
Recently, efforts have been initiated to come up with a universal graph query standard, GQL. The aim is for GQL to be a united standard across all graph-based systems, similar to what SQL is for the tabular data systems.
Standardization is a good sign for any technology. Hence, the GQL effort is a big positive.
Managed cloud services
Graph tech stands to benefit from being offered as managed services by various vendors, large and small alike. These offerings include the likes of AWS Neptune and Tigergraph cloud. This ties in with and is helped by the previous point about an open-source ecosystem.
Photo courtesy: ZDNet
Graphs in the wild
This section could justifiably encompass a whole article or even a series of articles.
For now, I’ll highlight some use cases. These outline a wide range of problem statements that can be tackled using graphs.
A common theme here is the importance of relationships.
- Knowledge graphs (KGs): Many organizations such as Google and NASA leverage KGs to improve services and internal efficiency. A KG stores information about a domain or organization in a graph format. It’s a highly relevant concept in an age where relationships between data points have become increasingly important.
- Data democratization and discovery: Data democratization means allowing end users, including non-specialists, to be able to access and analyze data without any external help. Read this fascinating account of how Airbnb enabled the same inside their organization with the help of a graph database.
- Investigative journalism: The ICIJ (International Consortium of Investigative Journalists) team behind the Panama Papers used the graph data model to effectively explore data. Even non-technical users were able to work with visually rich graph data.
Other notable use cases include data governance and compliance (Apache Atlas), recommendations (Pinterest, Amazon), and social networks (Facebook).
What are the technical challenges associated with data?
The challenges can be divided into two primary buckets:
1. A developing ecosystem and lack of consensus/standards
Whether it is choosing a tool for storing and processing graph data, or a suitable query language, making decisions can get overwhelming. But rapid progress is being made. The efforts made towards developing the GQL is a great example.
2. Converting data into a graph format
The process of transitioning data to a graph format can involve heavy processing and cleaning. It can also lead to data deduplication or record linking. Messier data makes the transition more painful.
Our data team at Atlan is heavily invested in data democratization and discovery—the primary motivation for our work on building a knowledge graph platform. The abstraction provided by a good platform will remove the challenges such as the ones mentioned above.
Should you use a graph database?
My advice: Know thy purpose.
You should carefully evaluate graph tech’s utility as per your problem statement. Some relevant ones include fraud detection, recommendation engines, and regulatory compliance.
There may be cases where graph tech may not be the best fit such as simple CRUD applications or systems where bulk scans of data are performed regularly.
Final words
I hope to have convinced you that in a world where data relationships are primary citizens, graphs are here to stay.
Don’t wait. Go on and traverse the land of graphs!
