The alternative data revolution isn’t about what alternative data to use. It’s about how to turn it into actionable insights.
If there is one thing every business in the world wants, it is market intelligence. By offering an untapped source of market intelligence, alternative data is revolutionizing how businesses make decisions and strategize for the future. Gone are the days of traditional data sources. Today, credit card transactions, patent filings, and even private jet movements are fair game.
Retail giant Walmart is already extracting value from every source of data, from its Social Genome Project (which predicts sales based on social media sentiment) to Polaris (an internal search engine that analyses customer searches). But, for businesses that are just starting to discover alternative data, it can be intimidating to figure out where to begin their journey.
Here, we highlight some ways that any business can start turning alternative data into actionable insights. After all, the alternative data revolution isn’t about what alternative data to use; it’s about how to use alternative data to stay ahead of the curve.
Make market-entry decisions strategically
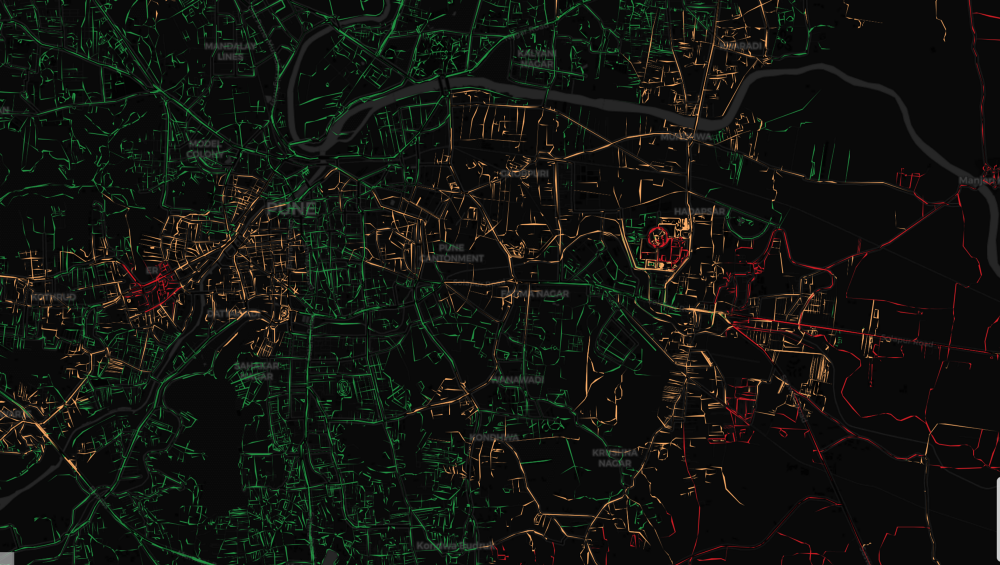
The countless ways through which alternative data can revolutionize decision-making can not be overstated. In his book, Lyseggen highlights the example of a glass manufacturer who uses the most unexpected data source to gain market insight — crime data. By keeping track of reported crime data, region-wise, the window manufacturer was able to estimate where and when demand to replace broken glass would increase. This hidden trend powered the manufacturer to stay one step ahead of his competitors.
While businesses have been using traditional economic indicators like spending potential to evaluate a specific region, they can now use more accurate measures from alternative data like the rate of urbanization and the economic growth rate to get a real-time, dynamic picture of how a region is changing. Combined with the Reachability Index, which measures the physical connectivity of a region through road, railway, and airway networks, businesses can be confident that they’re entering the fastest-growing markets.
Build brand awareness using real-time data
Brand awareness is critical for the long-term growth of any business. By crafting a powerful brand narrative that connects with consumers, businesses can build trust and loyalty. But how can large corporations build a consumer base in new markets that are hard to reach? How can they overcome cultural and language barriers to establish themselves? In fact, how can they even begin selling their products to a market that doesn’t know they exist? A large FMCG company in India figured it out.
Instead of directly marketing its product, an anti-bacterial soap, the company decided to switch things up. It used our disease outbreak prediction model, which was built from alternative data sources. Using the model’s weekly predictions, the company broadcasted safety alerts in high-risk villages. The brilliance of using this approach for building a brand in a new market can not be overstated. Through the use of cause-based messaging, the company was able to:
- Showcase a need for their product: By raising awareness of disease outbreaks and helping residents take preventive measures, the company not only highlighted a problem but also provided a solution for it.
- Overcome the challenges of rural India: With 650,000 villages scattered across 3.3 million square km of land and high supply chain costs, rural India is one of the hardest markets to crack. But, by targeting blocks with active disease outbreaks, the company was able to crack this market.
- Differentiate themselves from their competitors: The weekly infection alerts made rural consumers aware of the brand and its values. By marketing its mission, the company was able to build a loyal consumer base and differentiate itself from other competitors in the region.
This example shows how real-time data can be used to increase brand recognition. So, who knows? Perhaps tracking disease trends can be the answer to building your brand.
Gauge market shifts at an industry level
A hedge fund predicted an acquisition deal and its $766 million stake in a company increased by a whopping 20%. However, the hedge fund didn’t just shoot its shots. After tracking movements of J&J’s corporate jet, the fund discovered that the jet made frequent visits to Actelion’s headquarters in Switzerland. It then leveraged this knowledge to predict J&J’s historical $30 billion acquisition of Actelion and positioned itself to make the most out of this deal.
While it has always been important for businesses to gauge long-term market trends, the example of the hedge fund proves that, today, companies can physically and virtually track the market. They can use competitor footprints to gain a competitive advantage by analyzing how the internal focus of their competitors is shifting. They can ask critical questions. How are the job-boards of competitors changing? Are new hires focused on product or sales? What can their company acquisitions reveal about internal product roadmaps?
After all, if you notice a surge in their competitor’s online job postings for a sales team in Africa, they can, potentially, be planning a market expansion and chances are, you should be too.
Optimize operations using location intelligence

Businesses, governments and nonprofits are constantly launching new products, unrolling new schemes and expanding their market reach. However, with industries growing at a breathless pace, how can businesses ensure that their distribution networks are robust enough to reach new markets in the future?
Unilever, an international consumer goods company, successfully used weather data and location intelligence to optimize its logistics. The company was faced with a classic resource allocation question. While opening new retail stores across the world, in which stores should it install ice cream cabinets? Paying for refrigeration isn’t cheap, and the company needed to identify where its return on investment would be the greatest.
Instead of just using generic data to analyze which regions had the highest business potential, the company decided to use location intelligence. Firstly, it overlaid points of interest data such as elementary schools, playgrounds, and residential community locations with weather, demographic and economic data. Using this, it figured out that the best places to sell ice cream were hot areas with lots of young children. By focusing on weather, it could confidently predict where ice-cream sales were most likely to be the highest and it installed ice-cream cabinets in those exact regions.
Target philanthropic investments strategically

By now, you’ve probably heard that, in sub-Saharan Africa, one out of four people is undernourished. 23 million African primary school-going children attend classes hungry. However, did you know that nearly 50% of the food produced in Africa is wasted? This food could feed over 300 million people. What’s going on?
The food waste in Africa clearly proves that the question is no longer just one of resources, rather, it is also one of resource allocation. And it’s not just Africa. System inefficiencies are everywhere.
The truth is that system inefficiencies and coverage gaps in emerging markets can no longer be ignored. Philanthropies and non-profits looking to maximize their impact need to find and target these systemic inefficiencies. One way of doing this is to use indices created from alternative data.
For example, a Health Burden Index can use health center availability, staff data, and population data to accurately estimate where public health infrastructure is overburdened. Road data is crucial for calculating a village’s proximity to nearby health centers, since it shows how far people will actually have to travel for medical care. This index can help identify regions where health centers are failing and people don’t have adequate access to health care. Investments can, then, be focused in these regions. After all, the only way to fix a leaking ship is to fix the leaks.
Identify hidden market opportunities

Like we’ve said before, data intelligence is all about finding patterns.
It was one of these patterns, the relationship between night light data from satellites and a region’s economic status, that first suggested that countries like China and Russia were faking their GDP data. Why does this matter for your business? Well, as crazy as it sounds, you can use this relationship to discover hidden markets.
Simply put, night lights data measures the intensity of light in a region at night. Light intensity can be used to estimate economic status because as a region’s economy grows, the revenue of local businesses and consumers grows as well. Consequently, when consumer spending and financial investments in the region increases, the intensity of lights at night is also likely to increase.
Businesses can use this data to identify emerging markets and predict export demand. Because data on foreign economies has a significant time lag and the quality of data reported on several developing countries is poor, night light data can serve as a real-time indicator of how economies are growing. Additionally, by using satellite imagery to track areas with low physical connectivity, night light data helps overcome existing information gaps. So, move your business out of the dark and use night light data to power your search for new markets.
Leverage satellite data to gain insights

Satellites see past human blind spots and into the future. By providing high-value images of the planet in real-time, satellites are, undoubtedly, revolutionizing how businesses operate. From helping farmers monitor crops to optimizing how construction companies track inventory, data from satellites is playing a big role in transforming how businesses approach monitoring and evaluation.
Out of the infinite uses of satellite data, one powerful way in which businesses can use satellite data is to track commodities. With satellite launches skyrocketing in the recent past, satellite imagery can now be used to track every step of commodity production and distribution.
By tracking production plants, storage units and vehicle movements, businesses can estimate how supply of a commodity is changing in each region and leverage this information to increase prices in regions where supply is less than demand. Additionally, by tracking the capacity of storage tanks and the flows in pipelines, countries can also predict how a competitor’s oil exports are going to change in the future. So, from a competitor’s raw material inventory to a country’s exports, it is clear that nothing is beyond the reach of satellite data.
These various uses of alternative data make it undeniable that influential market patterns and forward-looking industry trends are out there. They also make it clear that if your business doesn’t use alternative data to discover them, it will be competing against businesses that do. The choice is yours — do you want to stay ahead of the curve with Atlan?


