
If you’re making decisions based just on internal data, you’re already behind the curve.
The sudden decline of Blackberry came as a shock to the world. A year before its revenue dropped by nearly half, tech-giant Blackberry recorded the highest number of smartphone sales in its history. In fact, in the same five-year period that the company’s share prices plummeted from $144 to $14, its revenue rose steadily. So, with increasing revenue and product sales, how did Blackberry start to lose a market it had practically invented?
Why does alternative data matter?
The reasons for Blackberry’s fall become evident as we zoom out from the company itself and start to focus on the industry as a whole. The launch of the iPhone in 2007 marked a shift in the smartphone market. Instead of using real-time data to understand this shift, Blackberry decided to continue using its internal data to design new products. The catch here is that Blackberry’s internal data just did not match reality anymore.
After the launch of the iPhone, Blackberry continued to insist that consumers wanted phones with a keyboard. They claimed nobody would buy a fragile phone that cracked with one fall, let alone one with a short battery life. However, if Blackberry had used opinion mining and sentiment analysis of Twitter messages, news forums, and internet queries to build a customer satisfaction index for the iPhone, it would have realized that consumers wanted exactly the kind of phone it insisted they didn’t want. Additionally, a demographic analysis of iPhone users would have shown Blackberry that even its target user base of working professionals and corporates was quickly moving towards touchscreen phones.
Blackberry’s new product launches leave no doubt — the company recognized the smartphone market was shifting. However, the sales of these products prove that, by limiting itself to internal insights, the company failed to recognize how the market was shifting.
This is a prime example of how making decisions using a company’s internal trove of data simply won’t make the cut anymore. Today, the world is rapidly evolving. Businesses don’t just have to move fast. They have to move fast in the right direction. This direction can only be found by leveraging internal company data with external data, and that is exactly where alternative data comes in.
What is alternative data?
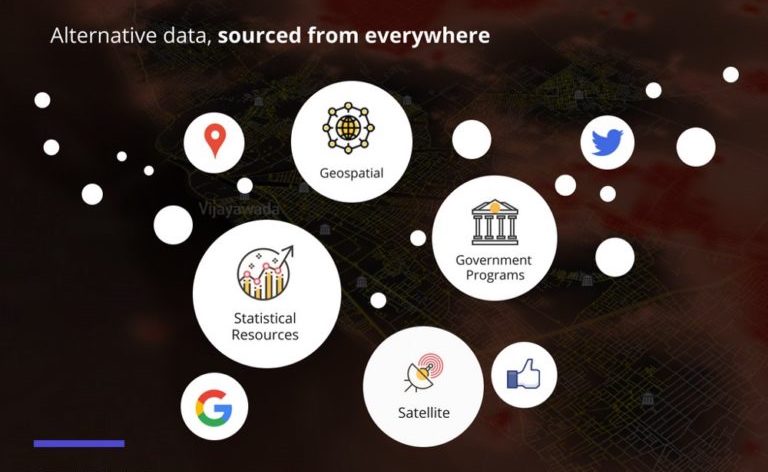
Alternative data is, quite simply, a transformation in how businesses think and make decisions. It turns any source of information into a tool for generating insights and driving business decisions of the future. The opportunities are endless. From satellite data to credit card transactions to Twitter messages, alternative data harnesses value from a broad range of untapped data repositories.
More specifically, alternative data opens up a whole new dimension for data analysis. It offers a way to move away from decisions driven by silo-ed, outdated, and limited internal data and uses the power of the latest external data sets.
According to Jorn Lyseggen, the author of the ground-breaking book Outside Insight, “External data is one of the biggest blind spots in executive decision making today. That’s because external information contains so much forward-looking information.” According to the book Big Data, 80% of relevant business information originates from external data. Indeed, external data paves the path from using what Lyseggen refers to as “shadows of opportunities that [businesses] had in the past” to leveraging business opportunities and market insights of the future.
Today, top hedge funds, banks and investors use alternative data to stay ahead of the market. In fact, in 2016, alternative data generated more than $200 million in spending. Just like alternative data has changed the finance industry, it has the potential to transform every industry and sector of the world.
How can you use alternative data?
Yes, alternative data is powerful. But, more importantly, it is useful.
What makes alternative data revolutionary is its ability to extract hidden patterns and unseen trends from a wide range of external variables that can influence a product. Alternative data answers questions by revealing underlying relationships between variables that can be used to gain a competitive advantage. For example, can you predict sales using the number of cars in a store’s parking lot? What about estimating demand for Pop-Tarts using weather data?
Yes, you read that right. Weather data can be used to predict demand for Pop-Tarts. In fact, Walmart increases its stock of Strawberry Pop-Tarts by seven times before a storm to meet a surge in demand. If you didn’t see that coming, imagine the number of trends you’re missing out on!
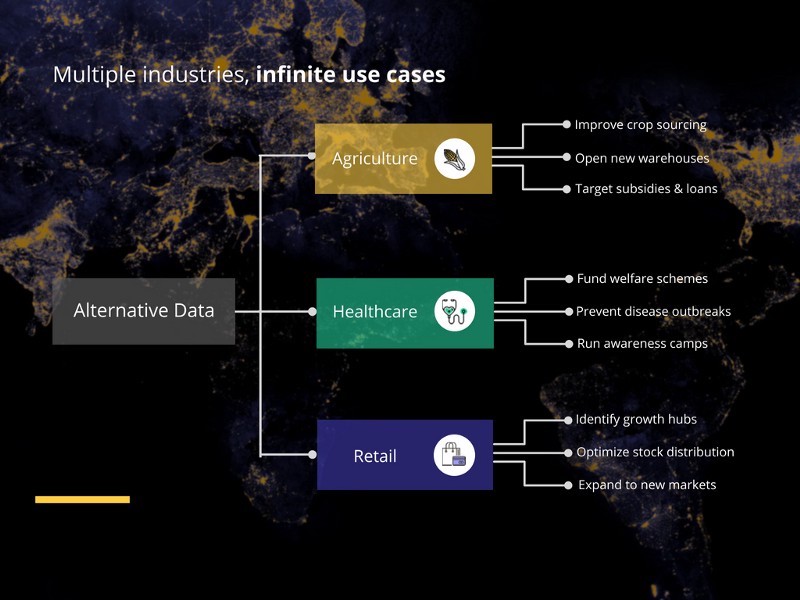
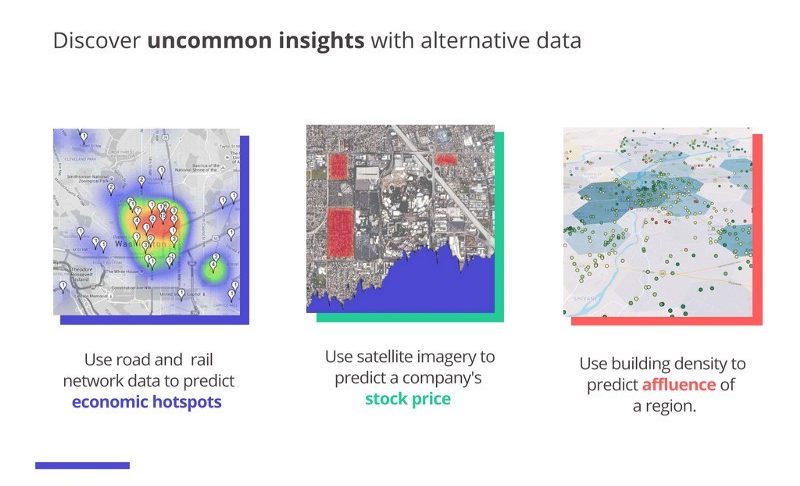
Well, you’re not alone. Grasping the full potential of alternative data can be hard, especially because its diverse applications aren’t immediately apparent. To make it easier to understand how alternative data can be used, here is a glimpse of just a few of the infinite decisions businesses can make using alternative data.
But, there is a catch.
Right now, there’s a reason that every business in the world isn’t using alternative data, and it’s simple — alternative data is hard to use.
At its very core, alternative data is chaotic. The lack of structure in the data makes it hard to process, analyze and store. Often, insights are buried in large file sizes, inconsistent data sets and slow processing times. The process of unearthing these insights is messy and complex. It’s like digging through a landfill, only you don’t know what you are looking for.
The truth is that the features that make alternative data so appealing also make it extremely challenging. Clearly, there is a need to take on these difficult challenges. our Grid meets this need.
What is Atlan Grid?
Atlan Grid is a global alternative data platform. Built to solve the world’s most critical problems, we are one of the world’s largest data repositories of alternative data. From satellite data to government reports, from structured, internal data to unstructured, external data, and from online PDFs to paper surveys, the data sources we use are broad and varied. However, what makes us different is that we don’t just sell data. Instead, we sell insights.
Atlan moves away from raw data and moves towards usable data. After processing and analyzing valuable data sets, we present businesses with hand-crafted insights that are ready to use. We do this by creating data insight packs and proprietary indices. For example, our Affluence Index can be used to predict sales by large FMCG companies or to target anti-poverty initiatives by governments, and our Malaria Forecast insight pack can be used to prevent disease outbreaks in real time.
Instead of abandoning companies to navigate a sea of data by themselves, we hand them a fishing pole and direct them to the best fishing spots. So, would you like to go fishing?


