
Introducing a framework to help data teams build a documentation-first culture
“What does this column mean?”
“There are two tables with the same name? Which one can I use?”
“Why are our MRR numbers different in the finance and sales reports?”
“Who can explain our marketing data?”
Messages like these seem familiar? Welcome to the life of every data practitioner in the world.
In 2016, I was at the helm of a data team that was rapidly scaling. We had vast amounts of new tables getting generated, new projects going live, and several new team members joining. But our team wasn’t built to scale.
Within six months, despite doubling our team members, our productivity actually dropped.
Only the older team members had enough context about the data we were using. So with our crazy deadlines, they ended up doing all the extra work themselves and were overworked. New team members were frustrated because they lacked the context they needed to actually do productive work — and when they did do work, it wasn’t useful. The company and culture I had spent so much effort building had started to deteriorate around me.
Then, to make matters worse, our oldest data team member, someone who’d been with us for two years, told me that he wanted to quit. I was shell-shocked. This analyst had literally all the context about all our data and projects in his head. We were growing fast, and we had our dream customers and projects lined up. I had looked into our customers’ eyes and promised that we would deliver. They had chosen to trust us. How were we going to follow through now?
After three hours trying to convince, cajole, and beg this analyst to stay, realization dawned… we were going to be on our own. I remember crying on the terrace of our office for three hours straight that night. It was one of the lowest moments of my life.
When I woke up the next morning, I remember making a promise to myself — never again would I give one individual the power to put us in that vulnerable of a position.
That incident marked the start of the Assembly Line Project: an effort to make our data team as agile and resilient as possible. Over two years, we created internal tools and frameworks to help our team run better, and we also learned a lot about building a stronger data culture around the principles of self-organization and transparency.
In this article, I’ll share the principles and framework we use to organize our own data team at Atlan, democratize our data, and make documentation a part of our daily workflow.
The road to a documentation-first culture
A documentation culture is exactly that… a “culture”. It’s a set of shared practices, beliefs, values, and ways of doing things.
As a lifelong student of culture and team building, one of my favorite reads on culture is Harvard Business Review’s article titled “Don’t Let Your Company Culture Just Happen”.
The authors talk about a framework called the culture map, which helps you have the conversations you need to design the culture you envision. It helps you define the three core elements of culture (quoted from HBR):
- Outcomes: These are the things you want (and don’t want) your culture to achieve.
- Behaviors: These are the visible parts of your culture — the positive or negative actions people perform every day that result in the desired or undesired outcomes for your company.
- Enablers and blockers: These are the formal or informal policies, rituals, actions, and rules that enable or block your culture — the elements that are truly intentional to achieving a desired culture.
Our team loosely followed this framework to guide our experiments towards building a documentation-first approach.
STEP 1: Envision the outcomes, or the ideal state to create shared purpose
At the end of the day, culture is built by people, and people are driven by purpose. It is important to remember that a documentation culture is just a means to an end.
At the end of the day, culture is built by people, and people are driven by purpose. It is important to remember that a documentation culture is just a means to an end.
I recommend sticky notes, a whiteboard, and a great facilitator. A great question to kick off an exercise like this is, “What do we want our team to look like in 12 months?” The role of the facilitator here is critical for combining ideas and thoughts into overall buckets.
If you run this session well, you might end it with outcomes like these from our team:
- Become a fully self-organized team: all your data, learnings, experiments, and projects should be reusable, transparent, and easily accessible.
- Create an environment of trust in your data and the decisions you drive.
- Build a collaboration-first culture: everyone should feel empowered and included, despite fundamental diversity in your team.
Once your team has an end state in mind, use a “Start, Stop, Continue” exercise to come up with a list of behaviors that can help your team get there. Hopefully, well-documented data will be on one of those sticky notes!
STEP 2: Build better behavior through measurable goals
Ask yourself, what does good documentation actually mean?
Once your team has identified that great documentation is one of the behaviors that you are striving towards, it is important to create a measurable goal that can help you determine what that actually means. I highly recommend the 5W1H framework for this.
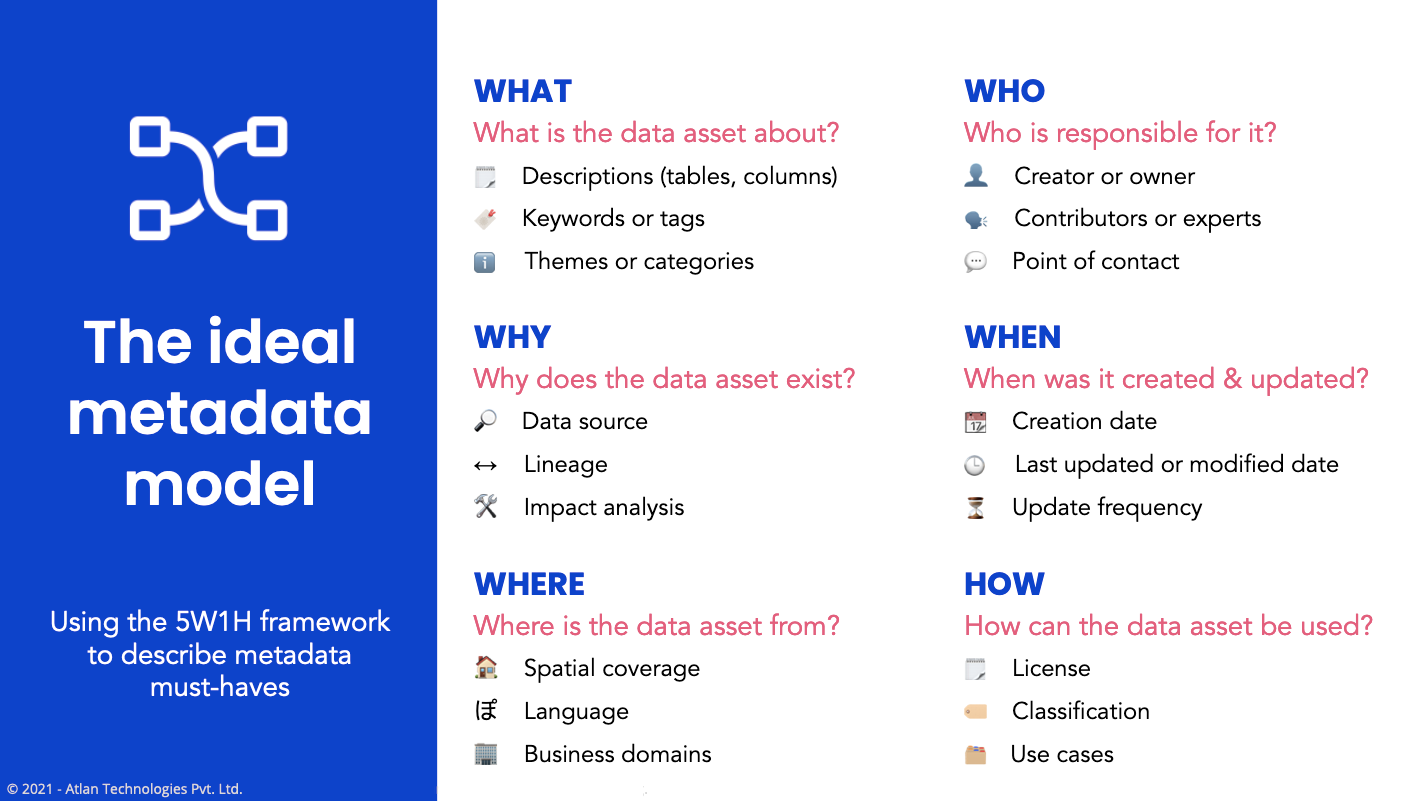
5W1H: A framework for great data documentation
The 5W1H framework stands for What, Why, Where, Who, When, and How.
Use the 5W1H framework to narrow down your metadata attributes to a short list of must-haves that you need to call every data asset well-documented.
WHAT: What is the data asset about?
This could be defined by several attributes such as:
- Descriptions (for tables or columns)
- Keywords or tags
- Themes or categories
WHY: Why does the data asset exist?
- Data source
- Lineage (tracing the data asset)
- Impact analysis (what dashboards or projects does this data asset power?)
WHERE: Where is the data asset from?
- Spatial coverage
- Language
- Business domains
WHO: Who is responsible for the data asset?
- Creator or owner
- Contributors or experts
- Point of contact
WHEN: When was the data asset created and updated?
- Creation date
- Last updated or modified date
- Update frequency
- Time frame
HOW: How can the data asset be used?
- License
- Classification
- Use cases
STEP 3: Measure what matters to pinpoint enablers and blockers
Once you have a framework for documenting data, there are many different ways to go from strategy to execution. (More on that in a future blog post!)
A common saying, apocryphally attributed to anyone from Drucker to Deming, is “If you can’t measure it, you can’t improve it.”
As data practitioners, we help everyone else apply their data insights, but we often forget to apply them to ourselves.
Measure progress on your documentation goals on a daily, weekly, and monthly basis. With modern data catalog tools like Atlan, you can use APIs to measure your documentation-completion rate at a granular level. Filter it by team members or different departments, and even create leaderboards!
Reflect together as a team on what’s working and isn’t. Keep iterating and improving your documentation frameworks and strategies. It takes time, but suddenly, one day you’ll wake up and realize that you have a documentation-first culture.

This article was originally published in Towards Data Science.


