
At Atlan, we’re huge fans of hacks that help us solve interesting problems and learn cool things in the process. The Data Team sometimes does quarterly hacks, where we dive deep into interesting data problems that we have talked about almost on a daily basis but never had the chance to fully explore. We start with an open-ended problem but focus on a fixed set of issues so we can reach a clear solution.
How we picked the problem
One day, my teammate Lilianna (who is an AIF Clinton Fellow interested in all things Indian) was very frustrated, since she was searching for a good 1 bedroom flat but couldn’t find one. Whatever she saw on real estate websites usually wasn’t helpful — either the property wasn’t good or the area around it wasn’t nice. Though some housing websites capture a lot of good metrics about location, price, and the property itself, she still had to play a guessing game on how accurate this information was and what important components the sites were missing. In short, she had trouble finding a flat because she couldn’t figure out an efficient way to explore and rank properties for each locality.
Thinking about this led us to a bigger problem — how can you effectively geospatially explore and rank a geographic area?
Here’s an example to understand this problem further. Imagine that a businessman decides to open a new warehouse for his FMCG company. This warehouse’s profitability depends on choosing the right location. The businessman has shipment data about his products and some intuition on where to open his warehouse, but he is not sure about his decision. This is an example of where geospatial ranking can come in handy. The businessman can reduce the ambiguity in his decision by ranking predefined areas based on geospatial metrics.
The base of our solution
We decided to take this idea and develop a more general solution for visualizing geospatial problems.
The first step was finding all our data. In geospatial problems, high-level answers just won’t do; if someone needs to know where to open a new factory, they need to know the best location, not just the best state or city. They might even need to compare relevant metrics across square kilometers. So, while gathering data, we aimed to capture even the smallest details about each area. First, we searched our secondary data repository for demographics data at a ward/pincode-level for every city. We then realized we can find even more granular metrics like individual restaurants and their reviews, cab rides, points of interest, and more. Since our aim was to capture as much detail possible about a geography, we decided to useAPIs to fetch these geospatial data points that, in today’s world, mirror parts of our economy.
Based on some primary data checks and data availability, we decided to use Bangalore as our test case. All of our data sets had a latitude-longitude field with the exact location for that data point in Bangalore.
Now that we had all this data, the second step was to aggregate it into geographic regions to make an informed decision. We first discussed using predefined administrative areas like pincode, ward, etc. However, there were two major problems with this. First, we would need shape files for every administrative area to help us visualize our data. But second, and more importantly, administrative areas are quite large, as compared to our problem size. For example, each pin code is 21 square kilometers on average. We wanted to dive deep into a very small area — maybe a square kilometer. Taking administrative areas as our boundaries wouldn’t give us that granularity and flexibility.
At this point, I remembered a similar project where I used geohashes to aggregate location coordinates. Why not try that same concept here?
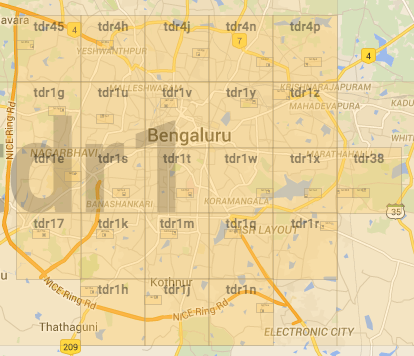
A geohash is a hierarchical spatial data structure that subdivides space into buckets in a grid shape. It is a well-known dimensionality reduction technique that transforms each two-dimensional spatial point (latitude and longitude) into an alphanumerical string, or hash. According to Elastic, “Geohashes divide the world into a grid of 32 cells — 4 rows and 8 columns — each represented by a letter or number… Each cell can be further divided into another 32 cells, which can be divided into another 32 cells, and so on… In other words, the longer the geohash string, the more accurate it is. If two geohashes share a prefix then it implies that they are near each other. The longer the shared prefix, the closer they are.” (To learn more about how geohashes work, check out here and here for a visual introductions to geohashes.)
Now what we were looking for was a dashboard to help us aggregate and compare our location data in grids. To keep our hack moving quickly, we decided to check out if any libraries or solutions already existed to help us to implement the geohash aggregation. This is when we realized the power of the ELK Stack.
What is the ELK Stack?
The ELK Stack consists of Elasticsearch, Logstash, and Kibana. Though they’ve all been built to work exceptionally well together, each one is a separate project that is driven by the open-source vendor Elastic — which itself began as an enterprise search platform vendor. Elastic is one component that we use in our tech stack at Atlan.
Here is how each component of the stack is used independently:
- Logstash: We’ll pass our json files to Logstash, play with the variable formats, declare an index and then pass it to Elastic.
- Elastic: It will process our data sets. It is a schema-less database that has powerful search capabilities and is easy to scale horizontally. Schema-less means that you just throw JSON at it and it updates the schema as you go. It indexes every single field, so you can search anything (with full-text search) and it will aggregate and group the data.
- Kibana – This is where we will visualize these geospatial data sets. It is a web-based data analysis and dashboarding tool for ElasticSearch.
Though the ELK Stack isn’t part of our data pipeline, we got a lot out of this beautiful set of tools designed to take data from any source and search, analyze, and visualize it in real time. Here’s how you can use the ELK Stack to create a geospatial dashboard in minutes.
How to create a geospatial dashboard with the ELK Stack
First, you will need the following:
- Logstash: I’m using 2.3.2
- Elasticsearch: I’m using 2.3.3
- Kibana: I’m using kibana-4.5.0-darwin-x64
Start your Elastic server by going to your directory and opening up an instance of elastic by typing /elasticsearch-2.3.1/bin/elasticsearch.
Once your Elastic server is up and running, go to your Logstash folder and create a .conf file. There are three sections to a .conf file: input, filter, and output.
- The input section specifies the input given to Logstash. In our case, this is the standard input.
- The filter section specifies the type of file (which is a CSV) and the operations we do to modify our variables for elastic (which is grouped under mutate). For geographic queries, it is important to group our lat-longs as geopoints for Elastic to identify them as a location variable.
- The output section specifies the standard output and how the data should be displayed while the indexing operation is on. While Elastic indexes our data, we will see the data on our screen, but we can use different codecs to change this behavior. If we do not want any information on our screens we can use dots as a codec. We will also define an index name in the output field, which will act as an ID to our data.
Execute this file in Terminal by going to the Logstash directory and passing the absolute path to our CSV file as an argument.
You may receive some errors at this point if your data isn’t in the format you mentioned in your configuration file. But if the code is error free, then we have successfully saved and indexed our data set and we can visualize it with Kibana.
To do this, open a new Kibana instance by going to the Kibana directory and calling ./Kibana from within bin. Make sure to keep your Elastic instance running at this point. Otherwise, Kibana won’t be able to revive connections and you will receive an error.
If this call is successful, head to localhost on port 5601 and welcome Kibana. Initially, Kibana will ask you to configure an index pattern. You can use the index name you created in Logstash. Make sure to uncheck “Index contains time-based events” if your index is not based on a time-based event. This is used for near real-time data sets, which was not our case.
Next, head to the Visualize tab and select the Tile map. Use “From a new search” to select your recently indexed dataset by selecting the index name from the dropdown.
Your right pane should show a world map view. Use “Geocoordinates” for aggregation, use your location field, and uncheck “Change precision on map zoom”. This will let you define your own zoom level to analyze, which will not change on zooming in or out of the map.
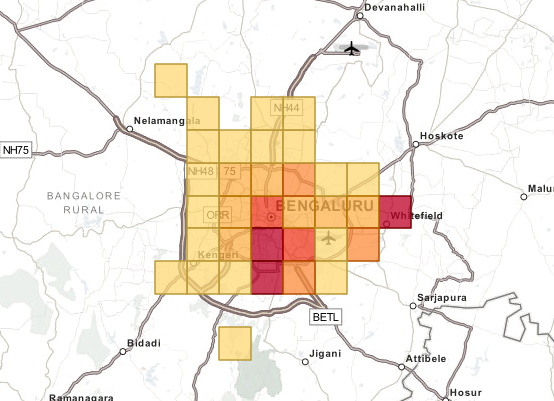
Next, go to the options tab and select “Shaded Geohash Grid” as the map type. As soon as you press the big green Play button, you’ll be able to see the shaded geohash grids. These are based on the metric you selected. The current metrics are count, sum, average, min, max, and unique count.
Kibana also offers a dashboard feature where we can combine all these independent searches in a dashboard. This dashboard can then be shared with anyone through a link, or it can be embedded this as an iframe within a website.

This is how easy it is to use the ELK Stack for doing some quick analysis and creating a geospatial dashboard. You can go down to as small an area as 8 square centimeters with using this technique.
The benefit of Kibana is being able to view and compare different parameters in the same dashboard view. Imagine the power when you combine the number of trips from a cab operator with the land prices of commercial and residential buildings, then compare that with the number and the type of reviews a particular restaurants is getting in an area.
Some other sample use cases of this technique are assessing marketing campaigns that are directed for a particular area, blacklisting sellers that don’t perform well based on reviews for a certain geography, or understanding delivery times in particular regions.
At Atlan, we believe in learning and implementing fast, and we’re always searching for solutions to make this possible. Since this project was a hack, we wanted to get to our results — a geospatial hash dashboard — quickly. However, it also helped us learn new aggregation techniques and tools. In the end, this was an awesome hack that also let us learn some minute details about Bangalore.
Do try out these tools and techniques, and ping us if you have a better use case or an idea in mind.


